Capstone Proposal Help for Masters and PhD
- IRB Process
- Consent Form
- Questionnaire Help
- Power Analysis
- Validity and Reliability
- Cronbach's Alpha
- Secondary Data
- Research Design
- Pilot Study

Hire a PhD Expert
Hire our PhD-level methodologists to align your dissertation topic, research questions, research design, model/theory, and statistical tests.
Sample Size Calculation
Scientific researches rely on surveys distributed among a sample of an entire population. If you want your sample to accurately represent the conditions of the whole population it intends to represent, your sample should include a specific number of individuals. Sample size can be chosen in various ways:
- Using experience-Sample samples can be chosen through experience, though it may result in wide confidence intervals.
- Using target variance for an approximate value to be derived from the sample that will be obtained.
- Using a target statistical test power to be applied after collecting the sample.
- Using a confidence level, given precision requirements, the larger the confidence level, the larger the sample size.
Sample size calculation helps to determine the amount of data you should have to make the right decision on a particular study. If you have more data, your decision will be more accurate since the error on the parameter estimate will be less. However, this does not mean that more data is the best in sample size calculation. With expertise in sample size calculation, you can use various statistical techniques and formulas to determine the sample size accurately. There are basic formulas for calculating sample size, although sample size calculation varies from method to method.
For instance, you will use the t-test to compare the means of two populations if the sample size is less than 30, and if it is greater than 30, then z-test is used. Sample size calculation also differs with different values of margin of error. Statistical consulting enables investigators to have a prior sample size calculation to know the number of participants they need for the study and sample size justification to justify the obtained sample. If you know the appropriate number of people for your study and justify the sample size, it will be easier to meet your effect size and power requirements. To calculate your sample size, you should determine a set of values and plug them into an appropriate formula.
Sample Size Calculation Steps
Part One: Determining fundamental values
- Know your population size
Population size is the number of people within the study demographic area. If you are conducting a more extensive study, you can use an approximate number.
Precision has a substantial statistical impact if you are working with a smaller group. For instance, if you intend to carry out a survey among workers of a small business, the population size should not exceed a dozen people or so.
You will have greater deviance in the actual population if your survey is larger. For instance, if your demographic includes people living in the United States, you could approximate the size, although the actual value may vary by a very large number.
- Determine your margin error
The margin of error is also referred to as confidence interval. It is the amount of error you can allow in your findings. Margin error indicates the percentage of closeness between your sample results and the actual value of the total population discussed in your research.
The smaller the margin error, the more accurate your answers will be. To get a smaller margin error, you should have a larger sample. The margin of error usually appears as a plus or minus percentage during the presentation of survey results.
- Set your confidence level
The confidence level closely relates to the margin of error. It measures the certainty level regarding how well the overall population is represented by the sample within the selected margin of error. In other words, if you choose a 95%c confidence level, it means that you are 95% certain that your findings accurately fall within your margin of error. If your confidence level is higher, it indicates a greater accuracy degree, and it can be obtained if you use a larger sample. The most confidence levels are 90%, 95%, and 99%.
- Specify your standard of deviation
The amount of variation you expect among your responses is shown by the standard deviation. Compared to moderate results, extreme answers have a high possibility of being accurate. For instance, if 99% of your responses were yes and only 1% no, the sample might be accurately representing the overall population. On the other hand, if 45% gave a yes answer and 55% a no response, there is a likelihood of error.
It is not easy to determine the standard deviation given the actual survey; therefore, most investigators set its value at 0.5. This value is determined for a worst-case scenario; hence using this value will guarantee that the sample size you have calculated will represent the overall population accurately within your confidence level and confidence interval.
- Find your Z-score
The Z-score is automatically set based on the chosen confidence level. It is usually a constant value that indicates the number of standard deviations between a selected value and the population’s average. You can use an online calculator, find the z-score on a z-score table or calculate it by hand. All these methods are relatively complex.
Confidence levels are fairly standardized, that is why most researchers memorize z-scores for the common confidence levels. Here is a list of the z-scores for the different confidence levels:
- 80% confidence=>1.28 z-score
- 85% confidence=>1.44 z-score
- 90% confidence=>1.65 z-score
- 95% confidence=>1.96 z-score
- 99% confidence=>2.58 z-score
Part Two: Using The Standard Formula
N= Population size
z= z-score
e= margin of error
p= standard of deviation
- Look at the equation
You should use the standard formula if you have a small or moderate population and know all the key values. The standard formula for sample size is:
Sample size=[z2 *p(1-p)]/e2 /1+[z2 *p(1-p)/e2 *N]
- Plug in your values
Plug in the numerical values that apply to your survey to replace the variable placeholders. For example, Given the following question: Determine the ideal survey size of a population size of 425 people. Use a 99% confidence level, a 50% standard deviation, and a 5% margin error. This means that:
- N=425
- Z=2.58
- e=0.05
- p=0.5
- Do the math
Solve the equation using the inserted values. The answer you will get will represent the sample size.
Part Three: Creating a Formula For Unknown or Very Large Populations
- Examine the formula
If your population is very large or unknown, you need to use a secondary formula. If you have values of the remaining variables, you can use the following equation:
Sample Size= [z2 *p(1-p)/e2 ]
Where; z=z-score
E=margin of error
P=standard of deviation
- Put your values into the equation
Replace the variable placeholders with the actual values for your survey.
Example: Determine the necessary survey size for an unknown population with a 90% confidence level, 50% standard deviation, a 3% margin of error. For a 90% confidence level, use the z-score would be 1.65. This means that:
- Z=1.65
- E=0.03
- P=0.5
- Do the math
Solve your equation after plugging the values into the formula.
Part Four: Using Slovin’s Formula
- Look at the formula
Slovin’s formula is a general equation used for estimating the population when you do not know the behavior of a particular population. The formula’ description is: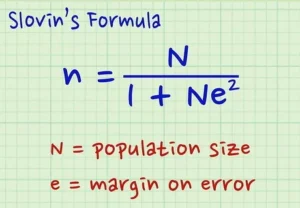
Sample Size=N/ (1+N*e2)
Where; N=population size
E=margin of error
Slovin’s equation is the least accurate formula and, thus the least ideal for use by researchers. You should only use the equation if you cannot determine the correct standard of deviation and confidence level.
- Plug in the numbers
Use the numerical values that apply t your survey in the variable placeholder in the formula.
Example: Calculate the necessary survey size for a population of 240, allowing a 4% margin error. This means that:-
- N=240
- E=0.04
- Do the math
Using your survey-specific values, you can solve the equation. The answer you get will be your necessary sample size.